Science: Geomorphology and Sedimentation
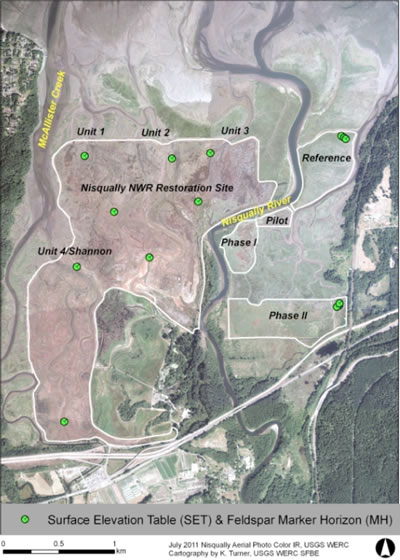
Figure 1: Location of Surface Elelvation Tables (SET) and Feldspar Marker Horizons in the Nisqually River delta.
Nisqually Surface Elevation Table Analysis: September 2009 to March 2012
Changes in elevation can lead to changes in inundation patterns and soil geochemistry and affect plant communities as well as benthic invertebrate prey. Changes in elevation can also lead to changes in the amount of time the marsh is accessible for foraging fish, birds, and other wildlife.
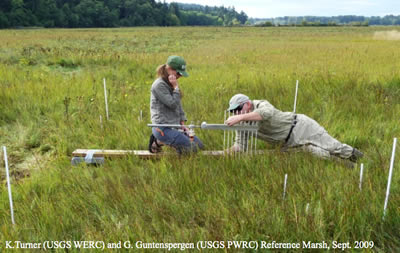
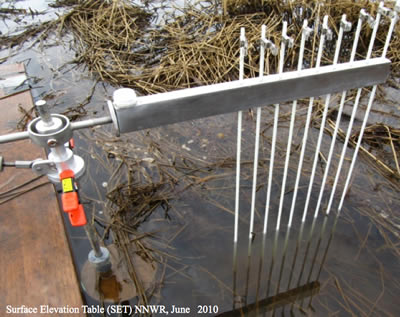
Surface Elevation Tables (SET) is a method to measure changes in sediment elevation within a wetland ecosystem (Cahoon and Lynch 2003). With the support of Glenn Guntenspergen and James Lynch (USGS Patuxent Wildlife Research Center) we installed 14 SETs at three study sites throughout the estuary: Nisqually National Wildlife Refuge (Refuge; restored in 2009), Phase II Tribal Restoration Site (Phase II; restored in 2006) and Reference marsh (Reference; Figure 1).
Monitoring of these SETS began in 2009 and will continue along with other associated post-restoration monitoring projects.
Surface Elevation Table Results
SET data shows an overall elevation increase each year throughout the delta, except for Reference Marsh in 2012 (Figure 2). The Refuge has consistently yielded the largest elevation increase from pre-restoration 2009 to the post-restoration 2012 measurements, presumably because those lands have subsided and are at the lowest elevations. In the first year following dike removal, the Refuge averaged a 37.3 mm increase in elevation, while Phase II marsh increased by 8.3 mm and the Reference marsh increased by an average of 1.8 mm. In the second and third year following restoration, the rate of elevation increase at the Refuge had slowed with an average elevation increase of 8.7 mm between 2010 and 2011 and 1.6 mm between 2011 and 2012 measurements. Between 2010 and 2011 the Phase II marsh had an average elevation increase of 5.4 mm and between 2011 and 2012 the increase was similar to the Refuge at an average of 1.5 mm.
The Reference marsh showed another small elevation increase in 2011 (1.7 mm), but lost 1 mm of elevation between 2011 and 2012. Based on sediment accumulation measurements around each SET, the primary driver of elevation increase in the estuary has been from sedimentation.
Feldspar Marker Horizon Results
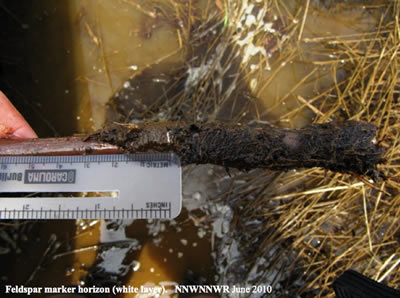
Feldspar clay marker horizons were also placed within proximity to the SET sites. When placed on the sediment surface, this bright, white clay serves as a clear soil horizon marker in a sediment core and is used to quantify sediment deposition and erosion. The absence of a feldspar layer in a sediment core indicates erosion. Paired with a SET, feldspar marker horizons can be used to help determine if changes in elevation are due to sedimentation or other processes.
Assessing the feldspar marker horizons on the refuge has been problematic in areas that were submerged and marker horizons were unclear or not found. Regardless we found that sedimentation patterns with feldspar marker horizon (Figure were consistent with the SETs data. The Reference and Phase II sites have consistently exhibited minimal accretion of sediment.
Figure 3: Mean sediment accretion (+ standard error) from feldspar marker horizons at three Nisqually Delta study sites from fall 2009 to spring 2012. Three feldspar marker horizon plots were located at each SET (Refuge N=24, Reference: N=9, Phase II: N=9).
Discussion
We found that the SET and feldspar marker horizon data showed similar patterns of sediment accumulation. Higher sediment deposition rates measured at the Refuge may be the result of multiple factors. The Refuge restoration area is generally lower in elevation than the surrounding study sites due to subsidence during a century of being disconnected from tidal flow. This means that this area is now inundated more often and for longer periods of time during a tidal cycle, thus exposing it more frequently to sediment rich waters. Prior to restoration and dike removal in October 2009, the Refuge restoration area was also vegetated with freshwater species, primarily the invasive Reed Canarygrass (Phalaris arundinacea). This tall grass died back with the
introduction of saltwater, either falling over in the same area in which it was rooted, or breaking off and resettling with the movement of the tides. Sediment has accumulated on top of this decaying vegetation creating a new sediment surface and is contributing to the increased surface elevation we measured. Long-term monitoring throughout the Nisqually estuary will enable us to relate wildlife responses to changes in elevation, hydrology, and geomorphology and to better understand if the estuary will be able to keep pace with sea level rise.
Sources Cited
Cahoon D.R., and J.C. Lynch. 2003. Surface Elevation Table Website, Patuxent Wildlife Research Center, Laurel, MD. U.S.A. http://www.pwrc.usgs.gov/set/